Science + trees = more trees!
It’s go time.
We are beginning the process of planting two million trees in our Irente planting site in Tanzania (introduced here). Because we want to do it right, we are partnering with Madrid-based GMV, a satellite monitoring partner that works with space agencies, governments, and people like us. GMV is the “leading provider of processing and applications for Earth observation”, and we are thrilled that GMW will help monitor our corner of the Earth in Tanzania.
GMV’s first task was to describe the initial “T0” (time zero) of the Irente planting site. The goal is to define a baseline as we begin to plant in this particular 2,200-hectare (about five square miles) “area of interest”, or AOI. In the coming months and years, we’ll track three important metrics, combining ground-level observations with satellite imagery reports for an accurate picture of:
● Tree count;
● Normalized difference vegetation index (NDVI): a satellite-based index measurement of the photosynthetic activity in a given region; and
● Soil moisture index (SMI): a satellite-based index of water in the soil.
The best time for T0
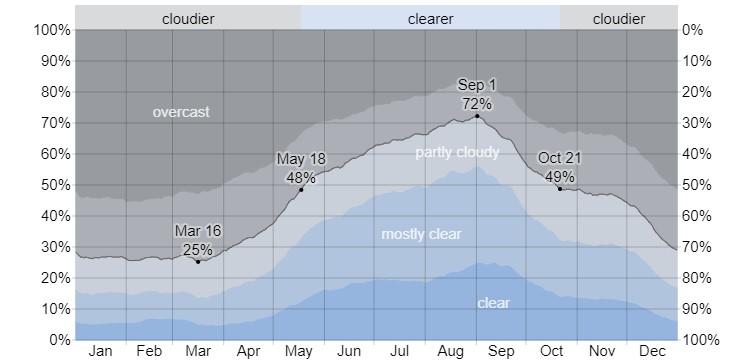
T0 must pre-date planting activity and consider what can be measured (or not) based on the weather. Satellite images need to have less than 20% cloud coverage to be suitable for analysis.
In the Irente AOI, the months of May through August typically experience little cloud cover and provide the best satellite data, allowing for high-quality satellite images that distinguish trees from other vegetation covers.
Consequently, July 2021 is T0 for all measurements going forward.
Pre-existing tree count
Before the launch of our project, there were already trees within the Irente AOI, but not enough to nourish soils or channel rainwater. After some consultation, the experts at GMV devised an approach that estimates the total number of trees in the AOI by measuring tree density in small sample areas. GMV counted trees in 30 sample areas to establish reference density and then made predictions regarding the spaces in between.
You can see the sample areas, which range from 142 square meters to 6,613 square meters, in yellow in the figure below.
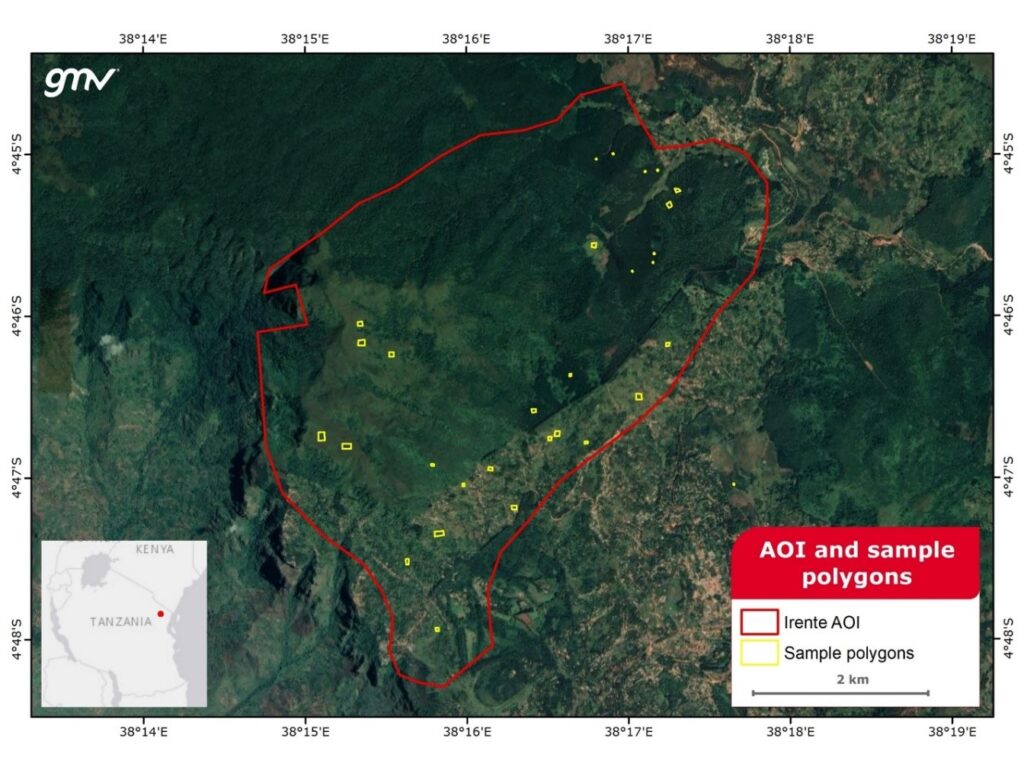
Results: The estimate is a total of 978,699± 64,561 trees in the Irente AOI with a confidence interval of 95%.
Trees need to be 2+ meters tall before it’s possible to count them accurately. Given the average growth rate of the trees in the Irente AOI, we plan to conduct another comparison tree count in July 2023.
Normalized Difference Vegetation Index (NDVI)
Multiple satellites collect surface reflectance (i.e., light wavelength) data from the Earth’s surface, and various measurement processes are used to analyze that data. NDVI measures vegetation presence, health, and condition, on an overall scale from 0 to 1. The measurement at T0 will serve as a baseline to study the evolution of vegetation in the AOI.
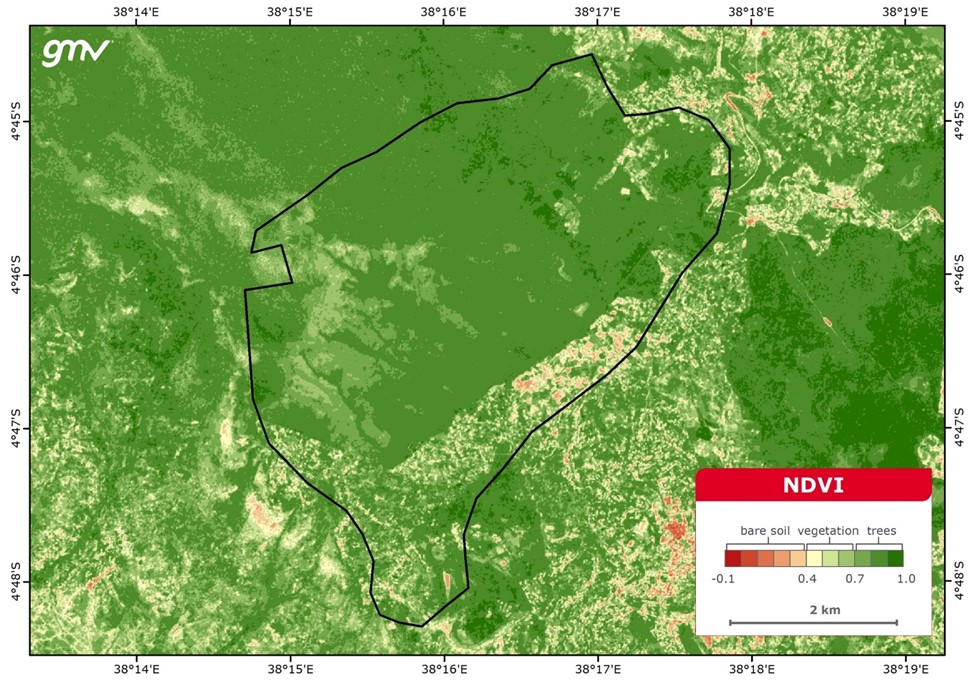
While there is a lot of green in the AOI, most of it is light green, indicating ground vegetation and shrubs. In the coming years, we expect to see NDVIs with darker green and with a more uniform distribution, indicating the presence of maturing beneficial trees.
Soil Moisture Index (SMI)
Our soil moisture estimates are from data provided by NASA, which has a 1 square km spatial resolution. We wish the granularity were higher, like the 100-meter spatial resolution of the NDVI measurements, but that isn’t possible at this time.
Another reason for setting T0 in July is that it is the middle of the dry season to minimize the possibility of corrupting the data due to soil saturated with water. The map below shows a positive correlation between forests and soil moisture. The mechanical action of the tree roots aerating the soil and the proportion of organic matter in forest soils result in more soil moisture.
While the low resolution of the source data prevents us from delimiting a sharp border between forest and non-forest areas, the comparisons are still striking. The blue-to-greyish areas with higher soil moisture values (0.30-0.60) correspond to relatively dense and very dense forests, whereas areas with a low presence of trees have values between 0.16 and 0.20.
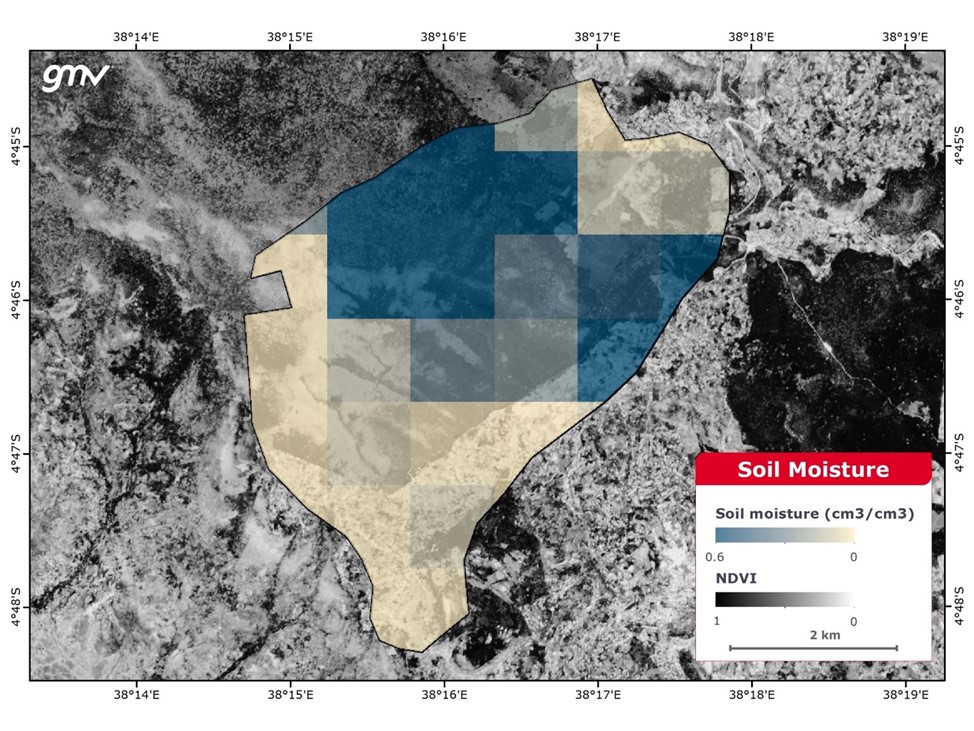
In this SMI image, the experts from GMV also under-layered the NDVI data (in greyscale) to demonstrate the difference and correlation between the two measurements. For example, plenty of green NDVI areas suggest vegetation with low soil moisture levels. This dovetails with what we see with scrub areas: they look green from afar, but their roots aren’t deep enough to channel and retain rainwater.
Conclusion: NEVER SEND A SHRUB TO DO A TREE’S JOB!
Why here?
Like many global initiatives, we need to start somewhere. Irente is in a mountainous area, where it is essential to minimize runoff. Roughly 3,000 people will benefit directly from the two million new trees planted in this area, in the form of increased soil quality and replenished aquifers. Additionally, about 50,000 people live at the base of the mountains and would be vulnerable to landslides and downstream flooding that occurs when rainwaters are not absorbed.
Updates
We plan to update the NDVI and SMI measurements annually, more frequently if possible. Make sure to Like us on Facebook and opt-in to our email list by clicking Get Updates above.
Very needed, and very exciting work being done!